The S&P 500 is becoming common language for anyone who is referring to “the market”. It’s also a great benchmark to see how markets are doing. With the prevalence of indexing and index funds, it’s also become a ubiquitous tool in constructing investor portfolios. The last several decades it’s crushed just about every other asset class. So the question is, is it all you need as you enter retirement?
Key Takeaways:
- The S&P 500 has a volatility profile that may make it difficult to be the sole investment choice in retirement
- Diversification is an easy way to reduce the risk of the S&P 500 and equities during retirement
- The current concentration of the S&P 500 has been a benefit recently but can hurt future performance
The Allure of the S&P 500
Over the past decade, index funds— funds that track a “passive index” such as the S&P 500—have become the default choice for many investors (ourselves included). Passive investing has consistently delivered strong long-term results for a broad range of investors and consistently out-performed active management writ large over time.
For U.S. investors, owning the largest 500 companies by market capitalization via the S&P 500 has worked incredibly well. It’s also become the benchmark for evaluating investment portfolios with such strong performance.
Over the last 10 years the S&P 500 has enjoyed a Compounded Annual Growth Rate (CAGR) of 8.23%. More than enough return to offset typical retirement withdrawal rates. How does it do it? First is to look at what makes up the index and where that performance comes from.
What Is the S&P 500?
The S&P 500 is a stock market index managed by S&P Dow Jones Indices. The S&P 500 was created to measure the performance of 500 large-cap U.S. companies, selected based on the following criteria:
- U.S.-based company
- Market cap of at least $14.5 billion (updated periodically)
- Adequate trading volume; must be listed on NYSE, NASDAQ, or CBOE
- Public float of at least 50%
- Positive GAAP earnings in the most recent quarter and over the past year
- Sector representation to maintain economic balance
Contrary to the term “passive,” the index is maintained by a committee that meets regularly to make adjustments. It’s not an automatic list—it’s a curated snapshot of the U.S. economy. Some might even argue it’s actively managed, just not by fund managers. S&P Dow Jones is in the business of formulating indicies. And for investors, that is helpful. Creating a basket of stocks that represent a country, geography, size can make it easier to properly diversify and for fund managers to appropriate compare how their strategies are doing.
However, these are people making decisions about what should be included. Back to the S&P500, a classic example recently of a company that probably should have been in the S&P500 way earlier but wasn’t, is Uber. Most notably, the committee looked at the fact they were not earnings positive as a reason to exclude them. Despite the fact they are one of the largest publicly traded companies by market capitalization and would easily be in on that criterion alone.
While you can’t invest directly in the index itself, ETFs and mutual funds like SPY, VOO, or IVV closely track it—and do so efficiently. You’ll notice on the bottom of most investment pieces referencing the S&P500 that you “cannot invest directly in indices”.
What stocks make up the S&P 500 today?
Although the index includes 500 companies, it isn’t equally weighted. (Though there are indices and ETFs that do equally weight them).
As of this writing, the top 5 companies—Nvidia, Apple, Microsoft, Amazon, and Meta—make up over 28% of the index. Expand that to the top 10, and you’re looking at roughly 38% of the total weight. You can see in the pie chart below the significant weight these companies hold.
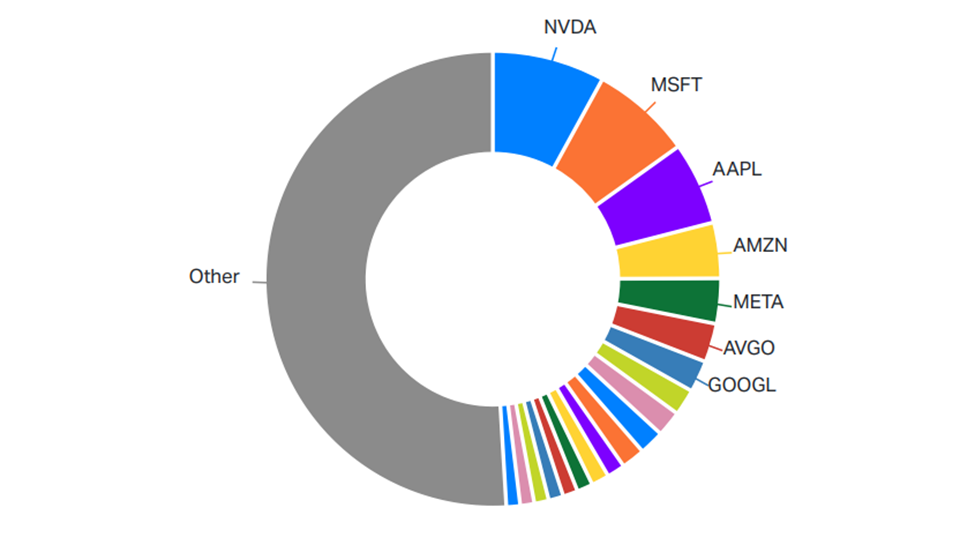
That surprises many investors who assume owning 500 companies equals broad diversification. In truth, the index is heavily influenced by the performance of just a handful of mega-cap tech stocks.
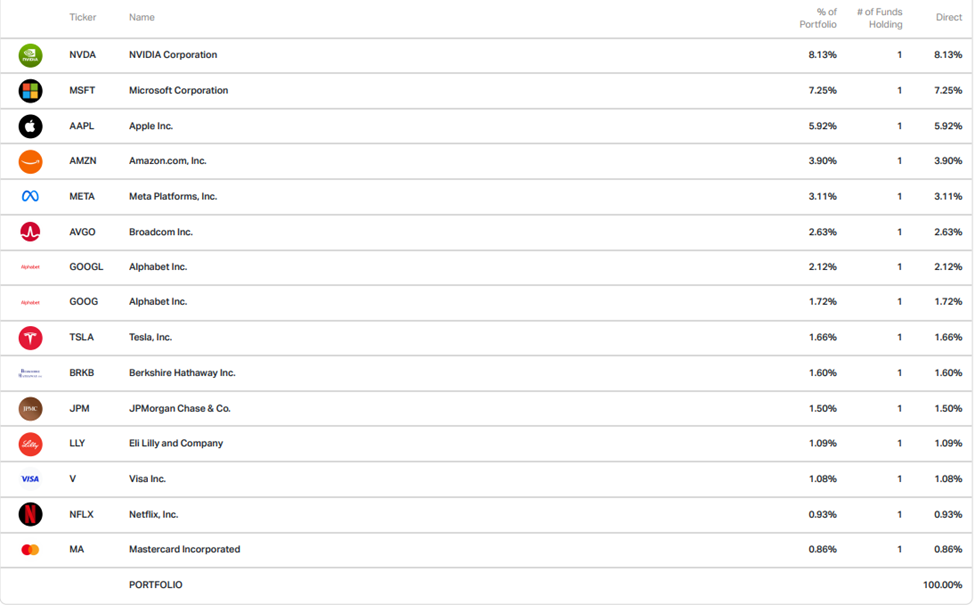
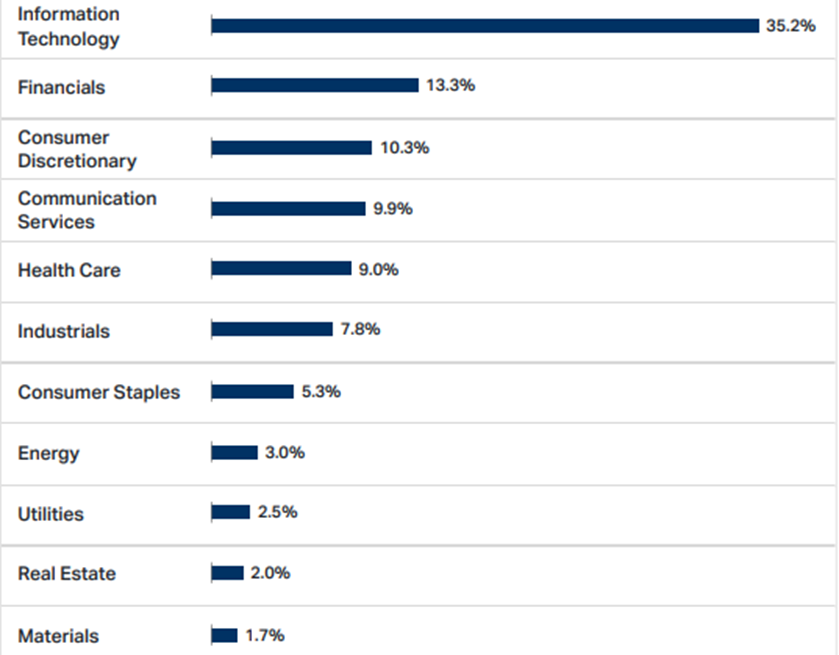
For example, Nvidia alone comprises more of the index than the entire industrials sector—which includes giants like GE, Caterpillar, Boeing, and Honeywell. So, what happens with Nvidia specifically all the sudden has a meaningful impact on the direction of your fund. The entire industrial sector could have a terrible year, and still wouldn’t have as much impact as Nvidia alone. The flipside can also be true, and has been. Nvidia has been nothing less than a case study in business success and investors in the S&P500 have been major beneficiaries.
Top-heavy weighting in the S&P500 is a feature, not a bug. The S&P500 is often concentrated in a handful of names as it’s methodology rewards the market “winners”. We’ve seen other historical periods with major concentration. Though today’s concentration is rapidly setting new records.
Why has the S&P 500 worked so well?
The S&P 500’s strength is in its simplicity: it rewards winners. Companies that perform well and gain market share become a bigger part of the index. Underperformers shrink in influence—or fall off entirely.
This natural selection is why the S&P 500 has historically delivered strong returns. Since 1972, it has averaged a compound annual growth rate (CAGR) of 10.78%.
And it works because it avoids second-guessing. Rather than trying to outsmart the market, it lets the market decide what deserves more weight. Market capitalization is share price x # of shares outstanding. So, the more a share price increases, as long as the shares don’t change, it takes up a bigger piece of the pie.
What about the other 99%?
While the S&P 500 captures the biggest U.S. stocks, it excludes a vast portion of the global market. There are approximately 54,000 publicly traded companies worldwide, and 4,700 in the U.S. alone according to Investopedia.
By investing only in the S&P 500, you’re intentionally ignoring thousands of small-cap, international, and emerging market stocks—some of which may be tomorrow’s top performers. Yes, many of those companies may be illiquid, speculative, or poorly regulated. But still, relying solely on 500 large U.S. companies can leave your portfolio overly concentrated—especially when 10 companies represent nearly half of the index.
What risk does just holding the S&P 500 have?
It might feel like the S&P500 has just gone up lately, but history tells us it has been a bumpy ride.
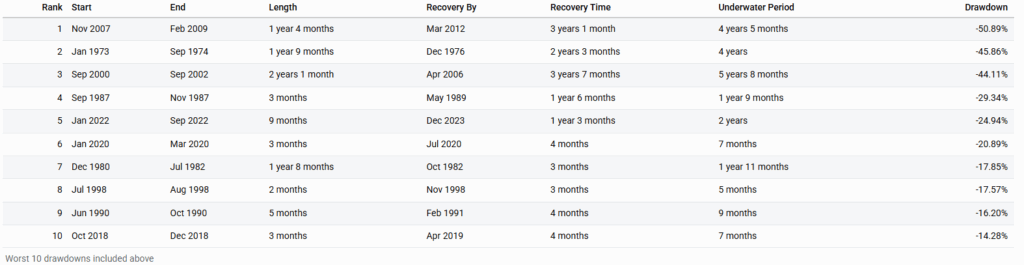
If you retire into one of those major down periods, you face a major challenge: sequence of return risk. Withdrawing from a declining portfolio early in retirement can drastically reduce your long-term sustainability—even if the average return over 20 years looks great on paper. The underwater period if invested entirely in stocks can be over 5 years! That’s just getting back to even, not counting withdrawals or inflation.
We’ve talked about it elsewhere, but what happens to your portfolio in the first 5 years of retirement can be one of the best predictors on the longevity of your assets. Noone knows exactly when the next 5 year period of negative returns can or will happen, but retiring in front of one of these periods can have significantly negative consequences. You can see below the rolling 5 year returns for the S&P500 index. This is a better way of looking way of seeing true performance as it measures your CAGR (annual returns) over a 5 year period.
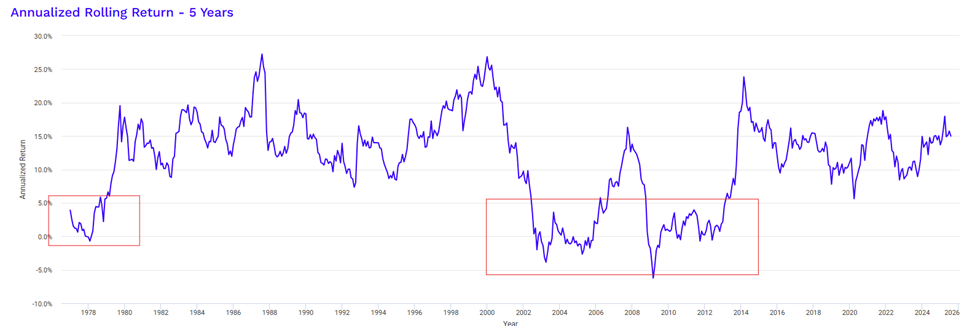
The boxes in the red represent rolling 5-year periods where returns would have been less than 5% CAGR over 5 years rolling. If you factor in inflation, the returns would be even worse. These periods represent really difficult times for anyone navigating retirement and taking withdrawals from their portfolios.
What Happens If You Add Bonds?
Diversification is the simplest and most effective way to mitigate that risk.
Let’s say you blend your portfolio to 60% S&P 500 and 40% in 10-year Treasuries. That same rolling 5-year chart now shows no periods of negative returns historically. Not a guarantee, but a powerful illustration of how diversification reduces risk. See the chart below for rolling 5 year periods of a 60/40 portfolio.
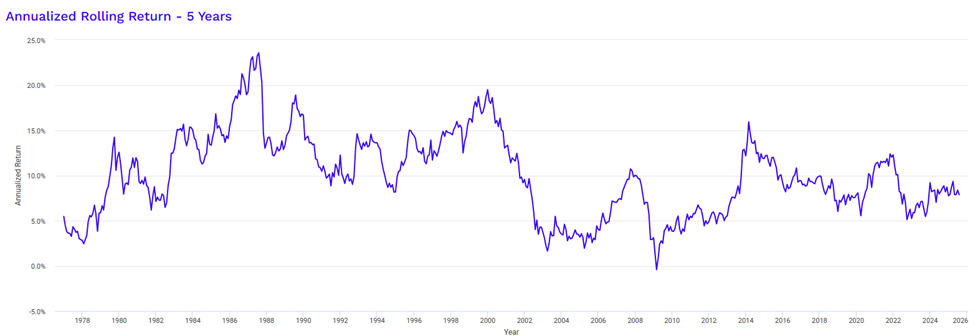
Yes, your long-term CAGR may drop to 9.45%, but you gain smoother performance—and avoid devastating drawdowns during those critical early retirement years. You’ll notice in the chart above the only negative 5-year period in nominal terms was the depths of the financial crisis.
Is the S&P 500 the Right Benchmark for Retirees?
Many professional investors benchmark their performance to the S&P 500. But if your portfolio includes bonds, international stocks, or real estate, is that really a fair comparison?
For retirees, benchmarking should be personal. Instead of measuring against an arbitrary index, consider:
- Are your investments on track to meet your goals?
- Are your withdrawals sustainable?
- Are your risks aligned with your time horizon and lifestyle?
A personalized benchmark, often built from a blend of passive indices, is more appropriate than the S&P 500 alone.
Final Thoughts: Should You Own Just the S&P 500 in Retirement?
The math on using just the S&P 500 does in fact actually work in a vaccum. However, the rollercoaster ride isn’t for everyone. In some of the more volatile periods of the early 70s and mid 2000s would have resulted in the loss of half or more of your portfolio in the first few years of retirement. Those are the periods where most investors are questioninig their sanity and whether this really is the right strategy. It’s easy to look in hindsight to see what worked.
The S&P 500 should likely remain a core component of most retirement portfolios, given its global economic weight (about 66% of world market cap). But owning it exclusively? That introduces risks—particularly around concentration, sequence of return risk, and lack of diversification.
In retirement, the goal isn’t to beat the market—it’s to generate reliable, sustainable income and preserve purchasing power.
That requires a broader approach. And that’s what we build for every client. If you have questions about your investment strategy in retirement, reach out for a free Retirement Review.
The information contained in this blog is for informational and educational purposes only and should not be construed as investment, tax, or legal advice. The views and opinions expressed are those of the author and do not necessarily reflect the official policy or position of Back Bay Financial Planning & Investments, LLC.
Any securities, indexes, or investment strategies referenced herein may be held in client accounts managed by Back Bay Financial Planning & Investments, LLC. Such references are for illustrative purposes only and should not be interpreted as a recommendation to buy, sell, or hold any specific security or investment strategy.
Past performance is no guarantee of future results. All investments involve risk, including the potential loss of principal. You should consult with a qualified financial professional before making any investment decision.
Any external links provided are for informational purposes only and do not constitute an endorsement or approval of the content, products, or services offered through those websites. Back Bay Financial Planning & Investments, LLC is not responsible for the accuracy or completeness of information found on external sites.